 After reading The Web Analytics: An Hour a Day I was supposed to write a short review of this probably the most pragmatic web analytics book written so far but Avinash Kaushik’s book makes so many revolutionary and sometimes provocative statements, which I can’t resist commenting on.
Here is the combined list of all interesting thoughts from The Web Analytics: An Hour a Day. Initially I tried to split them up into negative or positive category but even here the golden 10/90 rule applies as I can only refer to a couple small things as negative. I’ve decided to put them into categories, hope this format would work for everyone, so here are the categories:
- Remember list (18)
- Things you can learn (12)
- Great ideas (4)
- Things I personally (as a Web Analytics novice) don’t like about the Web Analytics: An Hour A Day. (7)
For those who don’t want to read the full review I might just say that Web Analytics: An Hour a Day id a fantastic resource and everyone interested in Web Analytics would find it useful to read. For advanced analysts though, there will be a lot of sections that you might want to skip but it should be still very useful even if you just want to find out how other analysts work.
List of things to remember from the Web Analytics: An Hour A Day
1. “all vendors use similar methods to capture data” – this is an important statement, even if you spend 200k on your sophisticated software the data will be captured in very similar way as in free tools such as Google Analytics. Think before your pay for gathering data.
2. “Data quality on the Internet absolutely sucks”, here are some most common reasons why: try tracking user activity in Ajax or Flash application, what if you’ve just realised that some of your pages weren’t properly tagged?, what is the definition of a visit? if i wait 30 min and come back to the site is it a new visit? Not many people know how the data is captured and why it rarely ties in with the data captured with another software.
3. “assume a level of comfort with the data” – don’t dive into the data and look at it with 70-80% confidence. See the point about the data quality above?
4. “go for free tools first” – when choosing right vendor, try the free tool and only if it has some limitations try buying one with more features
5. “ensure all pages are tagged” – write a simple software that will do it for you. It is just to ensure that your web analytics software is capturing all information that is available, i.e. you can trust your data more.
6. It happens that there are multiple source links on a website to the same target page”. Not many people realise how common this issue is, its bad for SEO and causes problems from a tracking perspective.
7. “spend time with your IT team and your web analytics vendor to understand
how sessionisation is done in the application” – assuming that all IT teams understand sessions and implemented sessions in the same manner might be a big mistake
8. “Remember that the unique visitors that we report use cookie values and
therefore are dependent on various issues that affect cookies”
9. When a user walks away from the browser, leaves it open or types in a different URL in the address bar the JavaScript tags have no way of knowing how long the customer spent on that last page, i.e. would report 0 seconds on the last page.
10. Thing to remember when you want to base your reports on page views: rich
media don’t use URLs to communicate with the server, i.e. the URL never changes when you navigate on a Flash or Ajax website (there is no such concept as a page)
11. Understanding multichannel marketing and tracking offline-to-online campaigns is very important; how often we assume that no external factors affect traffic trends on our website it’s good practice to have in mind all offline campaigns when it comes to tracking and traffic analysis.
12. When tracking customer behaviour consider also newspaper articles, visits to branches, call centre questions and purchases in branch or over the phone
13. “Most important cookies should be first-party cookies” – most of the antispyware software will reject third-party cookies.
14. Bounce rate is the first step in understanding whether you are getting qualified traffic.
15. Some websites such as support sites might require qualitative data rather than quantitative, which is better for e-commerce sites
16. Focus on short term goals, no point on setting five-year goals for the Web
17. Segment and try on a small scale, great advice it is so much easier to see things when segmenting data
18. “almost always path analysis rends to be a sub optimal use of your time, resource, and money”
Things you can learn from the Web Analytics: An Hour A Day
1. You can track Exit links, i.e. traffic leakage of the outgoing links
2. Multivariate testing explained in simple words
3. To ask “What is your hypothesis?” every time we are asked to change something in the template/design
 4. What is the DMAIC process and how you can apply it to web analytics?
5. “Measure the cookie rejection and deletion rates” – how often we are being asked how many people have cookies switched on or off?
6. Reasons why you won’t know all your referrers, i.e. you will see blank/null referrer. In reality you won’t know referrer for 40-60% of all traffic as it comes from bookmarks or direct entry (people who type in the URL in the browsers). Other reasons why you might not be able to see the referring source includes browser security settings, non permanent redirects, other campaigns where the referrer might not be passed properly.
7. Most people looking at the website performance have an obsession with their home pages, don’t be one of them. Usually the homepage does not account for the majority of traffic to the website.
8. “ask your agency not for data but for analysis”
9. how to track a blog and useful metrics, which enable to measure its success and also RSS feeds popularity metrics
10. Conversion Rate review (best practice) is very useful
11. Site abandonment rate (in percent terms) = 1 – (the total order placed on the website / the total Add to Cart clicks)
12. importance of surveys and qualitative analysis
1. Some powerful metrics for a support website include Problem resolution rate, timeliness, likelihood to recommend.
2. if you focus on sales, i.e. e-commerce goals and only 30% of your visitors
have some intentions to buy something you are ignoring 70% of your traffic; think about creating no e-commerce goals?
3. I like the idea of using colloquial language to name metrics, i.e. “less than one page” – “Abandoners”, “1-3 pages” – “Flirters”
4. Measure the real size of your convertible “opportunity pie” – interesting concept on calculating potential conversions
Things I didn’t like about the Web Analytics: An Hour A Day
1. It happens that Avinash Kaushik oversimplifies statistical & business aspects of web analytics. I’ve found a number of instances in the book where a fairly issue was explained in one sentence, there is also a lack of references to complex statistical books. There is nothing wrong with it unless you need to investigate the issue and need more details. So a general comment is that the book touches a lot of different areas of online but scratches the surface very often. I was mainly disappointed with seasonality and trend analysis, statistical sections (e.g. the one about statistical significance, it’s not that simple as it is explained),
2. Assumptions.
– One of the assumptions is about JavaScript tagging, which Avinash recommends as the best method for tracking. In Poland Internet users value their privacy more or they maybe just don’t trust The Web to the extent as people in other countries and would have their cookies switched off very often. It is definitely a factor to consider when measuring effectiveness of an online campaign in Poland.
– Another assumption “most of the click density in internal search should be clustered on the top five search results links, and no one should click Next Page” – I don’t think I would agree with it and also as a data enthusiast I would expect Avinash to present some analysis to prove it. It would be also interesting to see an industry breakdown as these metrics might be different for a shopping or support website.
3. I found the structure of the book difficult to follow. In the first part of the book there were too many “step by step” guides, which dilutes the focus of important sections of the book. The lack of clear sections/chapters such as tracking, reporting and analysis doesn’t help either. I’m not convinced that the “An Hour a Day” structure works very well.
4. Many irrelevant facts such as “if you are sending traffic to partner sites, consider asking them for a referring fee or at least reciprocal links”, there were times when I thought – Is that a web analytics book or a general overview of online strategies?. I know Aviniash might ask for some examples, as an example I would put here the whole SEO section (p. 204-207) and Web 2.0 (p. 314).
5. Inclusion ratio on page 217. In Google when you do site:www.domain.com it only shows an estimated number of pages. If you use URLs to track sessions the number you get from Google might be way off the real number. So if you are concerned about accuracy of this estimate run a crawler to find out what is the real number.
6. I’m not convinced about referring to Wikipedia when explaining definitions such as “statistics”, “search engine optimisation” and many, many, more.
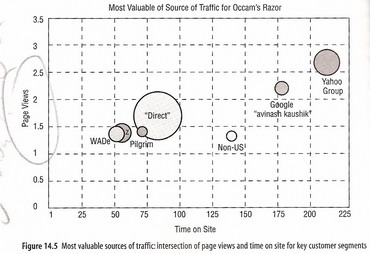
7. When Avinash revisits foundational web metrics he highlights downsides of the use of Page Views and even gives an example from his blog, i.e. the general message is “Don’t use Page Views as a metric”. In one of the last chapters, however, Page Views are presented as a very useful metric (see the chart below).

Luke: Thanks so much for taking the time to write a exhaustive review of the book, I really appreciate it.
You might have noticed a stress on customer centricity in the book with a recommendation for many ways to listen to one’s customers. In the same spirit feedback from the readers of the book is extremely helpful to me in multiple ways.
Thanks again,
-Avinash.